Q1 2026 Crypto Market Forecast: Institutional Outlook
Q1 2026 delivered a sharp correction that masked a more complicated structural story: prices fell hard while fundamentals in stablecoins and tokenization quietly strengthened. Total crypto market cap dropped roughly 20.4% to $2.4 trillion, Bitcoin shed 22%, and Ethereum fell 35%, yet stablecoin transfer volumes reached approximately $21.5 trillion and tokenized real-world asset activity continued to climb. Stablecoin.nyc tracks the institutional implications of that divergence across every layer of the market.
Definition: What Q1 2026 Looked Like in Numbers
The headline numbers are ugly. The composition of activity underneath them tells a different story about who was still trading and why.
Price Action and Market Cap Decline
Total crypto market cap fell approximately 20.4% quarter-over-quarter to roughly $2.4 trillion by the end of March 2026, per CoinGecko data compiled in the Bitwise and Idea Farm Q1 reviews. Bitcoin dropped about 22% from its ~$95K February high, with a drawdown that touched more than 30% at the trough. Ethereum fell approximately 35% over the same window, and all ten of the largest crypto assets closed the quarter red. For a longer read on how these cycles have shaped institutional posture, see our analysis of institutional crypto adoption.
Derivatives vs. Spot: Where Activity Concentrated
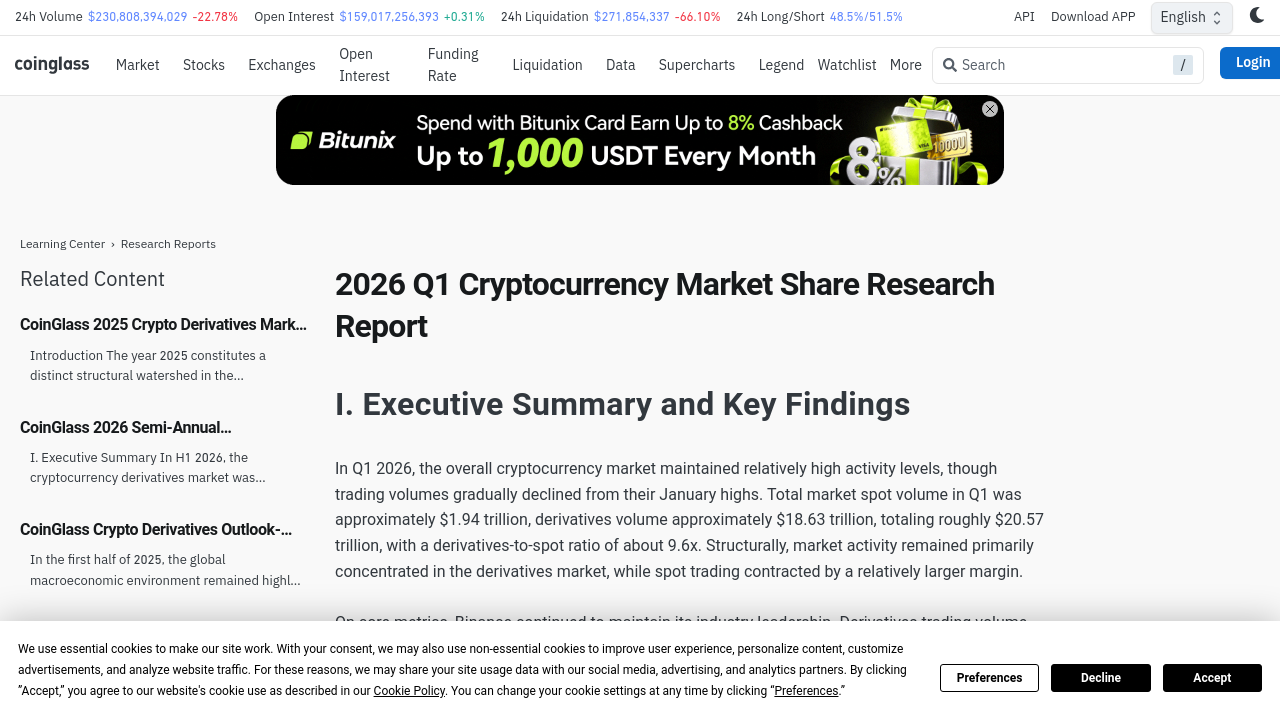
Total Q1 trading volume across spot and derivatives reached approximately $20.57 trillion, with a derivatives-to-spot ratio of roughly 9.6x, slightly above the 2025 full-year average, according to CoinGlass's Q1 2026 market share report. Spot averaged approximately $21.8 billion daily; derivatives averaged approximately $209.3 billion daily. Market-wide open interest averaged approximately $117.2 billion, peaking near $152.5 billion on January 15 before drifting lower as macro uncertainty intensified. The composition matters: sophisticated participants were still active, but they were hedging and short-dating, not building spot exposure. That skew is worth watching for anyone tracking the broader macro backdrop for crypto.
How It Worked: The Macro and Geopolitical Drivers

Q1 2026 was, first, a macro quarter. Crypto did not decouple from the risk complex; it followed it down and then began to differentiate.
Risk-Off Backdrop and Correlation Spike
Crypto's correlation with equities spiked noticeably early in the quarter, undermining the well-worn narrative around Bitcoin as an uncorrelated hedge during the initial leg of the drawdown. Risk appetite had not fully recovered from the severe deleveraging that closed out Q4 2025, and that residual caution kept spot market volumes suppressed through March. Larger-cap assets held relative leadership while smaller-cap tokens underperformed more severely, a pattern typical of late-stage risk-off phases rather than idiosyncratic crypto breakdown. Our ongoing market analysis tracks the interaction between crypto beta and traditional risk assets across cycles.
Bitcoin's Relative Resilience After February 28
The Iran conflict that broke out on February 28 paradoxically coincided with Bitcoin showing notable relative strength versus both equities and gold in the following weeks, per Coin Metrics data cited by Talos. Improving ETF demand over the course of the quarter helped BTC find support at prevailing levels. The takeaway for allocators is not that Bitcoin passed a safe-haven test in the cleanest sense; it is that the second half of the quarter produced a differentiated pattern worth separating from the January-February selloff. For institutions building policy around Bitcoin exposure, this is a data point that argues against a single-quarter verdict on correlation, and it fits the broader story we cover across institutional coverage.
Why It Matters: The Price-Fundamentals Divergence

If you only read the price tape, Q1 was a bear quarter. If you read the on-chain data, it was an unusually productive one. That divergence is the entire thesis.
Stablecoins: Record AUM and Transaction Volumes
Stablecoin supply held steady near approximately $300 billion while adjusted transfer volumes grew to around $21.5 trillion in Q1 2026, with transaction activity surpassing major payment networks including Visa, per Coin Metrics data published by Talos. Stablecoin AUM reached a new all-time high during the quarter, even as crypto prices fell, suggesting institutional and commercial adoption continued to accelerate independent of speculative cycles. This is the clearest evidence in the report that the utility layer is not a beta trade on token prices. For readers new to the mechanics, our stablecoin category coverage unpacks how supply, distribution, and settlement fit together.
Tokenized Real-World Assets Building Momentum
Tokenized real-world assets kept rising as a category, with onchain equity and index perpetuals on platforms such as Hyperliquid and new stock perps from major exchanges driving steady growth in open interest. Emerging regulatory clarity around stablecoin yield and distribution is actively shaping the sector's trajectory, according to Bitwise and Talos research. For a concrete example of how RWA tokenization plays out at the asset level, see our primer on real estate asset tokenization.
Onchain 24/7 Markets for Traditional Assets
The most durable Q1 development may be the migration of traditional assets onto 24/7 onchain venues. Equity perps, index perps, and stock perps now trade continuously against stablecoin collateral, which changes the plumbing rather than the pricing model. Bitwise analysts described Q1 dynamics as consistent with late-bear patterns: weak prices, renewed builder activity, with stablecoins and tokenization as the clearest forward-looking indicators, per the Bitwise Q1 2026 review. The rails matter here; our writeup on crypto payment rails covers the settlement-layer implications for treasury teams.
Common Misconceptions About Q1 2026

Three narratives dominated the quarter. Each is defensible on the surface and misleading underneath.
Misconception: Price Decline Signals Structural Failure / Reality: Fundamentals Diverged Positively
All 10 of the largest crypto assets fell in Q1, which led many observers to conclude the asset class was in retreat. On-chain metrics point the other way: active stablecoin usage, tokenization activity, and settlement throughput continued to strengthen. Prices are a lagging read on a market that is still building distribution, and mistaking one for the other is how allocators miss re-entry windows. Our coverage of digital asset payments is one lens on where that distribution is showing up in real commerce.
Misconception: Bitcoin Failed as a Safe Haven / Reality: Post-February Resilience Complicated the Narrative
The sharp early drawdown prompted safe-haven skepticism. But Bitcoin's relative outperformance versus equities and gold after the February 28 geopolitical shock introduced meaningful nuance. A quarter is too short to settle the correlation question in either direction, and the honest read is that the pattern shifted mid-quarter as ETF flows improved. For a broader view of the fundamentals framework we use to weigh these claims, see the dedicated hub.
Misconception: Institutional Interest Retreated / Reality: Allocation and Infrastructure Activity Continued
Wall Street moving on-chain, clearer regulatory frameworks, and continued institutional allocation were all underway during the same quarter that produced the sharpest price declines, per Bitwise CIO Matt Hougan. The elevated 9.6x derivatives-to-spot ratio reflects active hedging and risk management by sophisticated participants, not speculative abandonment. The Glassnode and Coinbase institutional report described a constructive stance for Q1 2026, noting that risk had shifted into options and leadership concentrated in larger-cap assets, a pattern typical of bottoming rather than breakdown. For a payments-side view of institutional adoption, our comparison of stablecoin rails versus SWIFT frames why treasurers are still building even in weak tape.
Related Concepts for Institutional Allocators
A few frameworks are worth carrying into Q2 conversations with investment committees and treasury teams.
Passive vs. Active Stablecoin Supply
Passive stablecoin supply sitting idle in wallets versus active transfer volume is a key signal of whether adoption is distributional or merely custodial. Q1 2026's $21.5 trillion in transfer volume against a roughly $300 billion supply base implies high velocity, consistent with transactional use rather than parked capital. For the custody side of that equation, see our roundup of stablecoin payment infrastructure providers and custodians.
Hot-Start vs. Cold-Start in Onchain Markets
Tokenized equity perpetuals on decentralized venues like Hyperliquid represent the hot-start problem applied to traditional assets: bootstrapping liquidity for 24/7 onchain versions of instruments that already trade in deep off-chain markets. The advantage is a reference price and existing hedgers; the challenge is that liquidity must be paid for until organic flow arrives. The distinction between open and closed stablecoin networks is a useful analog for how these liquidity dynamics resolve.
Exchange Concentration and Liquidity Tiering
Binance held approximately 34.3% of top-10 spot volume and 34.9% of top-10 derivatives volume in Q1 2026, with user asset reserves of approximately $152.9 billion, roughly 9.6x the next largest CEX by that measure, per CoinGlass. The market formed a clear tiered structure: Binance at tier one, OKX and Bybit at a distance in tier two, with Gate and Bitget trailing. Liquidity concentration matters for execution strategy and counterparty policy, and it should inform how allocators think about venue diversification. Our fundamentals hub includes wallet and custody analysis relevant to how institutions actually hold and route stablecoin balances across those venues.
How to Get Started: Positioning for Q2 and Beyond
Q1 gave allocators the raw material to update priors. The question is whether the update is directional or structural.
What the Data Signals for Institutional Portfolios
The combination of record stablecoin AUM, rising tokenized RWA activity, and improving ETF demand amid price weakness historically precedes recovery phases. Allocators anchored to lagging price data risk missing early re-entry signals. Regulatory progress on stablecoin frameworks remains the single variable most likely to accelerate institutional onchain exposure, with clarity on yield-bearing stablecoins as the near-term catalyst worth monitoring. For a practical treasurer-level framing, see our overview of payment orchestration and how it interacts with stablecoin flows.
Key Metrics to Watch in the Quarters Ahead
Fidelity and other traditional asset managers have flagged November 2026 as a potential cycle bottom based on the four-year Bitcoin cycle thesis, though on-chain fundamental strength in Q1 may compress that timeline. Three metrics deserve daily attention:
- Stablecoin transfer volume relative to supply (velocity).
- Tokenized RWA open interest across onchain venues.
- Derivatives-to-spot ratio, where a sustained decline from 9.6x toward spot-led volume would indicate genuine risk-on rotation.
Infrastructure-layer adoption, stablecoins, tokenization, and 24/7 settlement, is proceeding independently of speculative price cycles, warranting a separate evaluation framework from token beta. Our research and resources hub collects the source material and frameworks we use to track it.
FAQ: Frequently Asked Questions
What happened to crypto markets in Q1 2026?
Total crypto market cap fell about 20.4% to roughly $2.4 trillion. Bitcoin dropped 22% and Ethereum fell 35%, yet stablecoin transfer volumes reached approximately $21.5 trillion and tokenized RWA activity kept climbing across the quarter.
Why did Bitcoin fall so much in Q1 2026?
Bitcoin declined roughly 22% from its ~$95K February high, driven by a risk-off macro backdrop, elevated correlation with equities early in the quarter, and residual deleveraging from Q4 2025. ETF demand improved later in the quarter and helped stabilize prices.
What is the institutional outlook for crypto after Q1 2026?
Institutional research from Bitwise, Coin Metrics, and Glassnode reads Q1 as constructive despite weak prices. Stablecoin AUM hit new highs, tokenization advanced, and derivatives structure suggested hedging rather than abandonment, a pattern more typical of bottoming than breakdown.
How did stablecoins perform in Q1 2026?
Stablecoin supply held near $300 billion while adjusted transfer volumes grew to roughly $21.5 trillion, with transaction activity surpassing Visa. AUM reached a new all-time high, indicating continued commercial and institutional adoption independent of token price cycles.
What are tokenized real-world assets and why did they matter in Q1 2026?
Tokenized RWAs are traditional assets, equities, indices, treasuries, issued and traded onchain against stablecoin collateral. In Q1 2026, onchain equity and index perpetuals on venues such as Hyperliquid drove steady open interest growth, signaling migration of traditional markets to 24/7 rails.
Is Q1 2026 the start of a crypto bear market?
Bitwise analysts characterized Q1 dynamics as consistent with late-bear patterns rather than the start of one: weak prices paired with renewed builder activity and strengthening fundamentals in stablecoins and tokenization. Interpret it as a mid-cycle reset rather than a new downcycle.
How did derivatives markets behave relative to spot in Q1 2026?
The derivatives-to-spot ratio held steady at roughly 9.6x, slightly above the 2025 full-year average. Spot averaged $21.8 billion daily against $209.3 billion in derivatives, indicating traders favored hedging and short-term positioning over directional spot allocation.
What should institutional investors watch heading into Q2 2026?
Watch stablecoin velocity, tokenized RWA open interest, and the derivatives-to-spot ratio. Regulatory progress on yield-bearing stablecoins is the highest-use near-term catalyst. A sustained shift toward spot-led volume would signal genuine risk-on rotation rather than technical bounce.
Conclusion
Q1 2026 was a bear quarter for prices and a builder quarter for infrastructure. The record stablecoin activity, tokenization progress, and constructive derivatives structure argue against reading the price tape as the full story. Institutional allocators who separate the token-beta cycle from the settlement-layer cycle will make cleaner decisions heading into Q2. For ongoing coverage of that split as the data develops, visit the site's analysis section.