Stablecoin Dominance: What It Measures and How to Read It
Last updated: October 12, 2026
TL;DR
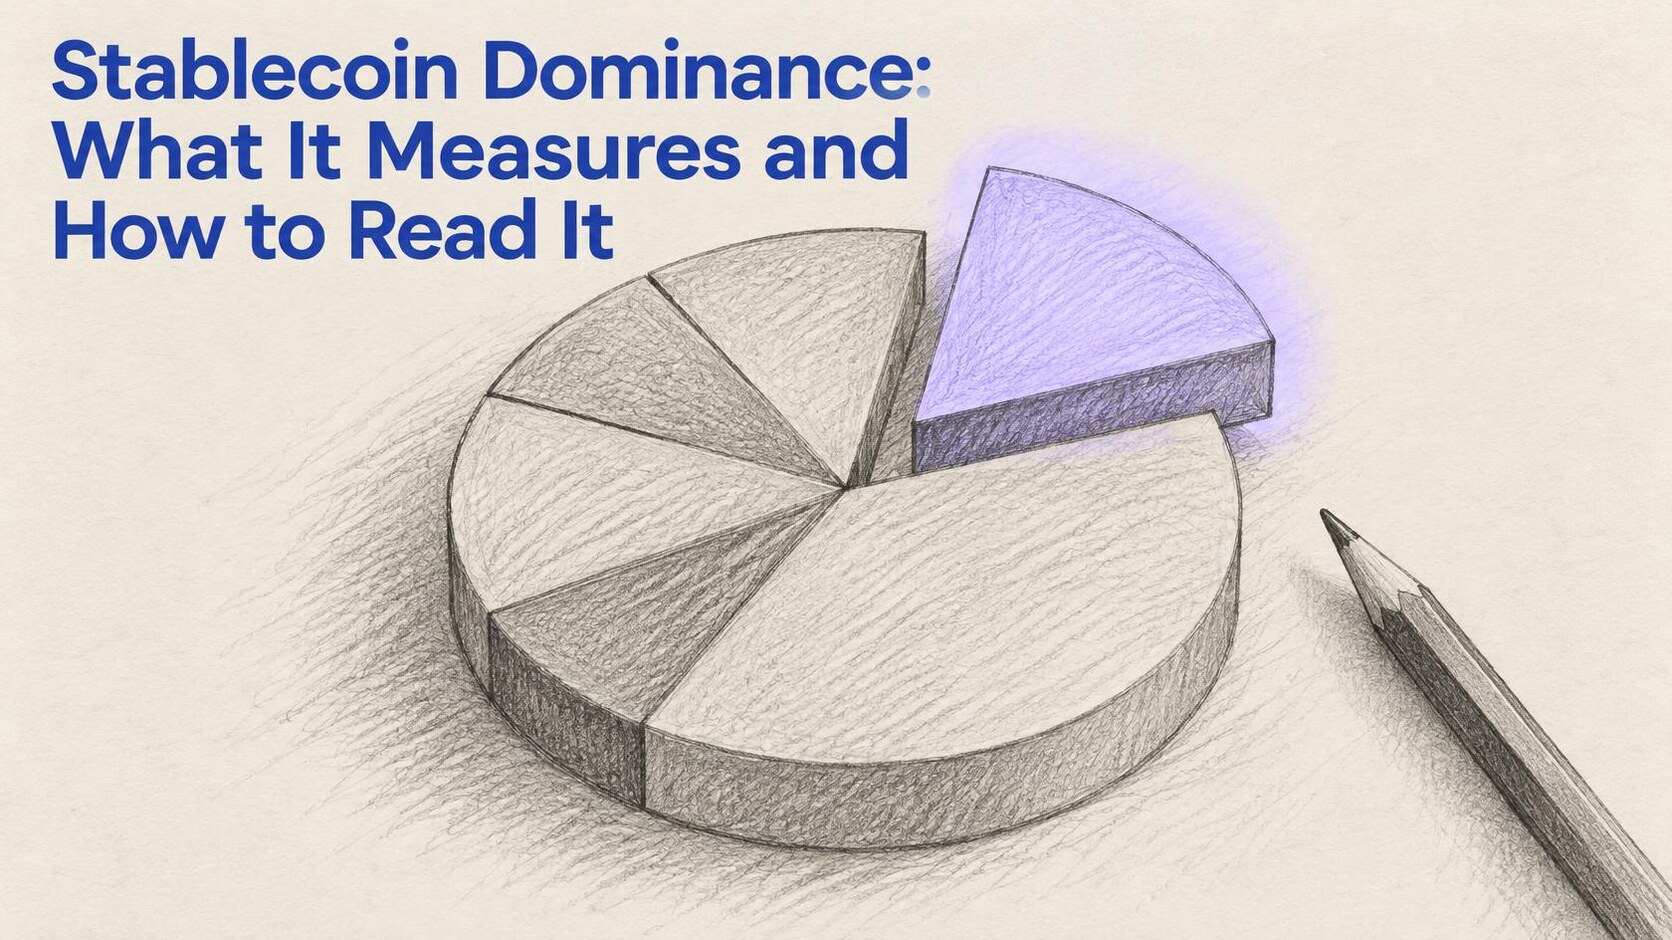
Stablecoin dominance is the share of total crypto market capitalization held in stablecoins. Traders read rising dominance as risk-off, with capital parked in dollars, and falling dominance as risk-on, with capital moving into Bitcoin and other tokens. It is tracked on TradingView as STABLE.C.D and USDT.D. The signal has become noisier as stablecoins grow for payments rather than only as trading cash.
How stablecoin dominance is calculated
The formula is simple:
Stablecoin dominance = total stablecoin market cap ÷ total crypto market cap × 100
Dominance can move for two different reasons, which is the first thing to check when reading the chart:
| Move | Cause 1 | Cause 2 |
|---|---|---|
| Dominance rises | New stablecoins minted (capital arriving in dollars) | Other crypto prices fall (same stablecoins, smaller total) |
| Dominance falls | Stablecoins redeemed or converted into crypto | Other crypto prices rise |
The term is also used a second way: a single stablecoin's share of the stablecoin market. USDT held about 58% of stablecoin supply in April 2026, according to DefiLlama data, while USDT and USDC together held roughly 82% of supply by August 2026. "USDT dominance" on TradingView (USDT.D) is a third measure again: Tether's share of the total crypto market.
What stablecoin dominance signals
The traditional reading treats stablecoins as the market's cash position:
- Rising dominance: traders are selling volatile assets into stablecoins, or prices are falling. Usually bearish for crypto prices.
- Falling dominance: stablecoins are being deployed into Bitcoin and other tokens, or prices are rising. Usually bullish.
- High dominance after a sell-off: often read as "dry powder" waiting on the sidelines, which can fuel the next rally once it is spent.
A related metric is the Stablecoin Supply Ratio (SSR): Bitcoin's market cap divided by total stablecoin supply. A low SSR means stablecoins have more buying power relative to Bitcoin. As of August 2026, the SSR was about 4.16, with Bitcoin's market cap near $1.28 trillion and stablecoin supply near $308 billion, according to Spark.
Why the signal is getting noisier
The framing I keep coming back to: stablecoins used to be crypto's cash register; they are becoming the internet's dollar account. That breaks the old assumption that every stablecoin is waiting to buy crypto.
A growing share of supply now sits in payments, remittances, business treasuries and dollar savings outside the US, none of which is likely to rotate into Bitcoin. That structural demand pushes dominance up regardless of trader sentiment. Mid-2026 showed the effect: Bitcoin traded flat to lower even as stablecoin supply held near all-time highs, a combination the old reading would have called bullish fuel.
Composition is shifting too. Supply is spreading across more issuers, yield-bearing tokens and regulated bank stablecoins, so single-issuer dominance figures like USDT.D say more about Tether's market share than about market mood. Our stablecoin market cap breakdown tracks those shifts.
How to use stablecoin dominance
- Check which way the denominator moved. Separate new stablecoin supply from falling crypto prices before drawing a conclusion.
- Pair it with supply flows. Net minting and exchange inflows tell you whether new dollars are arriving.
- Watch exchange balances. Stablecoins sitting on exchanges are closer to buying crypto than stablecoins in payment wallets.
- Treat it as context, not a trigger. It is a sentiment gauge, not a trading signal on its own.
FAQs
What is stablecoin dominance?
Stablecoin dominance is the percentage of total cryptocurrency market capitalization held in stablecoins such as USDT and USDC. It is used as a sentiment indicator: higher dominance suggests investors are holding dollars rather than volatile crypto, while lower dominance suggests capital has moved into Bitcoin and other tokens.
Is high stablecoin dominance bullish or bearish?
Rising stablecoin dominance is traditionally read as bearish in the short term, because it often reflects selling or falling prices. Very high dominance after a sell-off can be read as bullish later, as idle stablecoins represent potential buying power. Growing payment use of stablecoins makes both readings less reliable than in past cycles.
What is USDT dominance?
USDT dominance, shown as USDT.D on TradingView, is Tether's share of the total crypto market capitalization. Traders watch it as a risk-off gauge, since USDT is the main trading pair on many exchanges. Separately, USDT's share of the stablecoin market was about 58% in April 2026.
What is the Stablecoin Supply Ratio?
The Stablecoin Supply Ratio (SSR) divides Bitcoin's market cap by total stablecoin supply. A lower SSR means stablecoins have more potential buying power relative to Bitcoin. It was about 4.16 in August 2026, with Bitcoin's market cap near $1.28 trillion and stablecoin supply near $308 billion.
Where can I track stablecoin dominance?
TradingView publishes stablecoin dominance as STABLE.C.D and Tether's share as USDT.D. DefiLlama, Artemis and CoinGecko track total stablecoin supply, issuer market share and chain distribution, which help explain why dominance is moving.
The takeaway
Stablecoin dominance still measures how much of the crypto market sits in dollars, but those dollars increasingly serve payments rather than waiting to buy tokens. The open question is whether analysts start splitting trading stablecoins from payment stablecoins, which would revive the indicator's signal.